Free and open source

Burndown

See the limit coming.

Your Claude plan has limits, and Claude does not show you much about them. Burndown puts the whole picture in your Mac menu bar: how much of your session and your week is left, which conversation is spending it, where every token went, and when your current pace runs out of road.

Download for macOS Read the guide
Price
Free
Sign-up
None
Your data
Stays here
Source code
Open

Every feature on this page is in the download: no paid tier, no ads, and no upgrade screen waiting for you at 80%. Nothing you do is sent anywhere, because there is nowhere for it to go, and you can read the code to check rather than take my word for it.

HOMEBREW_CASK_OPTS="--no-quarantine" brew install --cask maz0x/tap/burndown
macOS 13 or later. Universal, Apple Silicon and Intel. It updates itself.

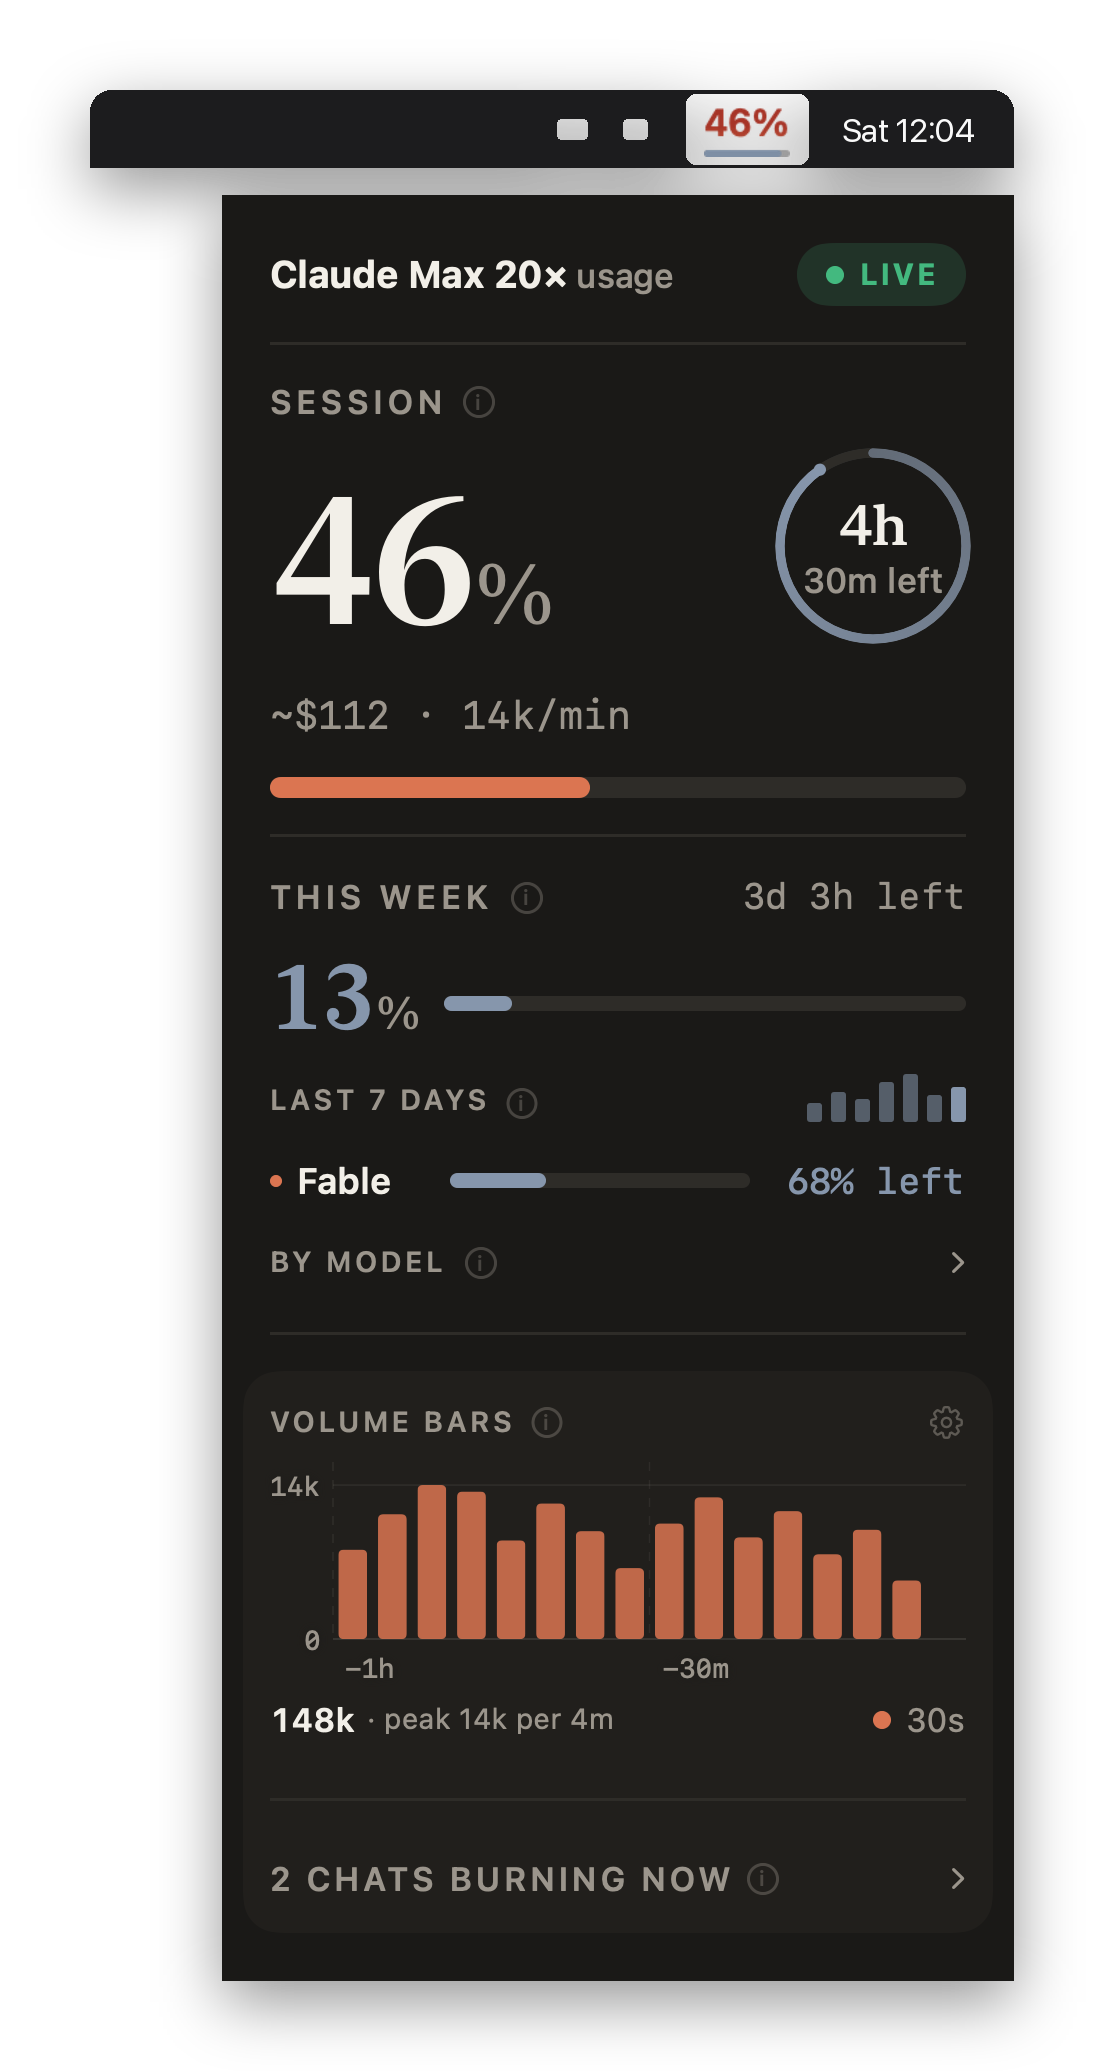
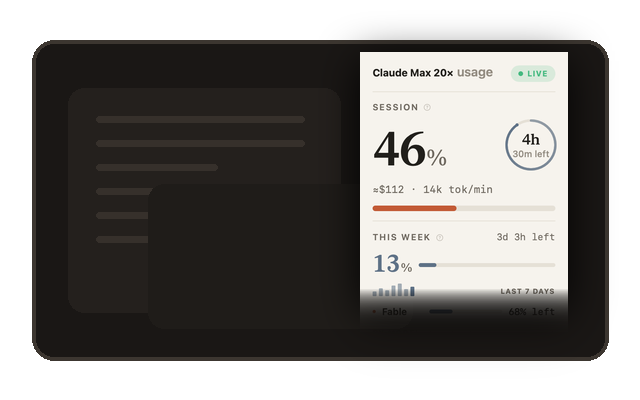
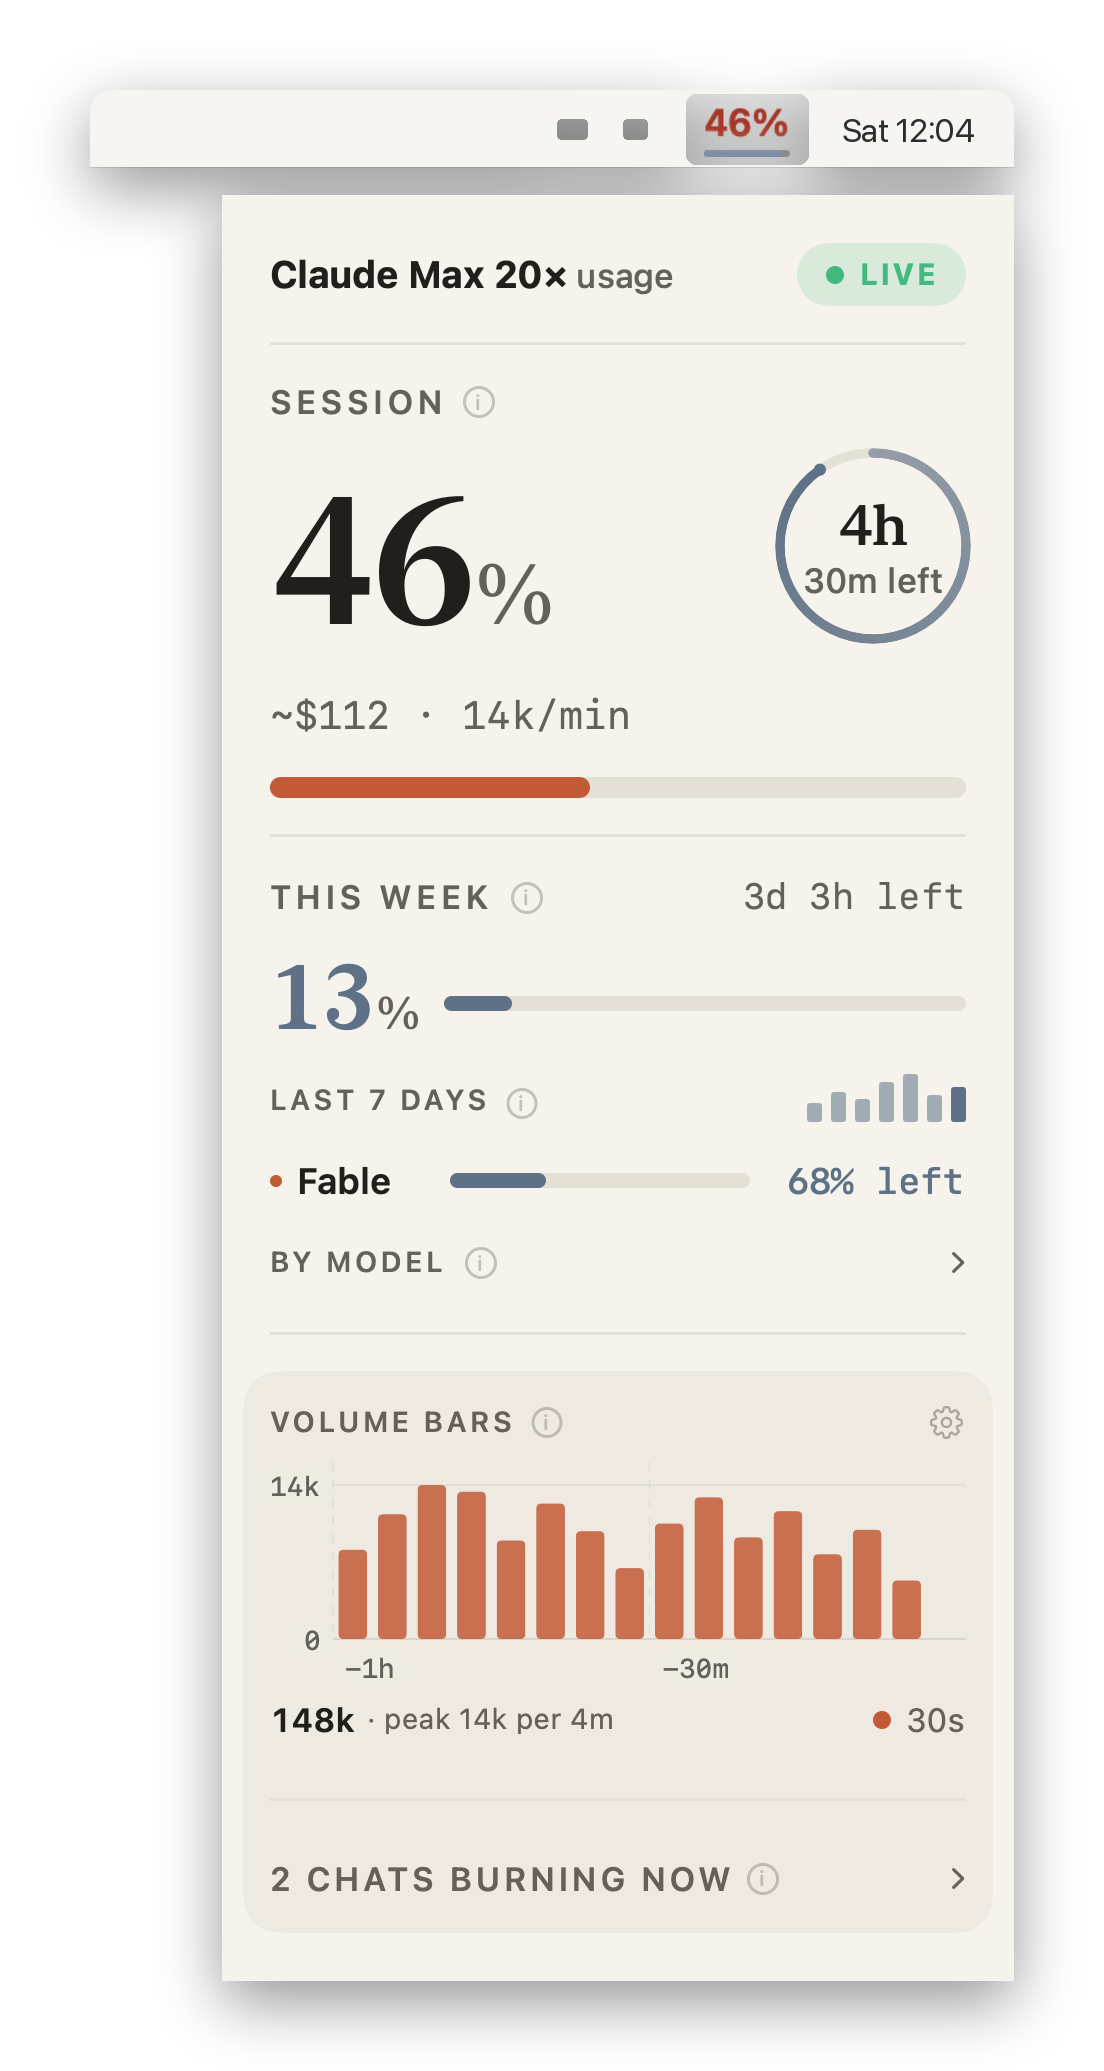
The Burndown card in light mode: 46 percent of the Claude session used, time to reset, weekly usage, per-model caps and a burn chart The same Burndown card in dark mode

What you get

Everything about your Claude usage, in one place

Not just a percentage. Burndown answers the questions you actually have: am I fine for the rest of the day, what ate my week, and should I switch models before the good one runs out.

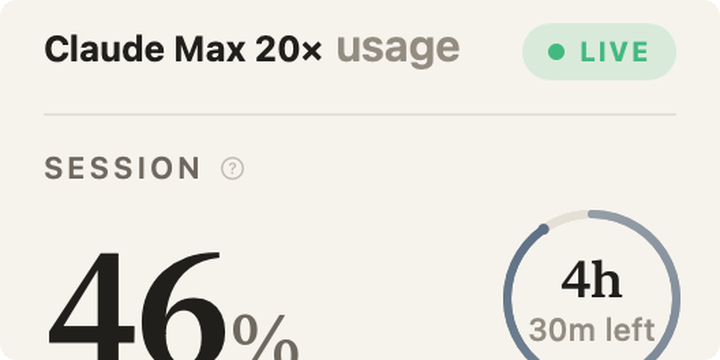
The Burndown card: 46 percent of the five hour session used, with the time left to reset

The whole card

Session and weekly percentages with reset clocks, every per-model weekly cap, live tokens per minute, and what the same work would have cost at API list prices.

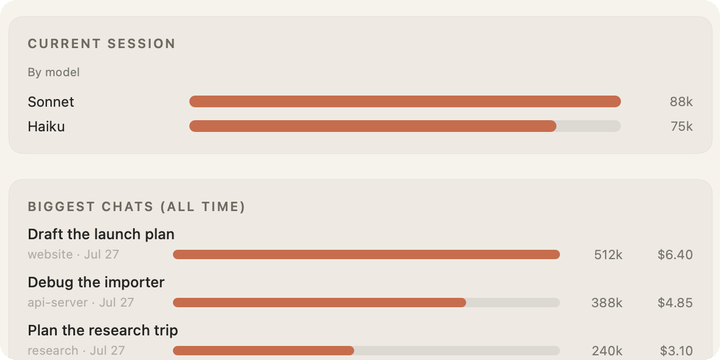
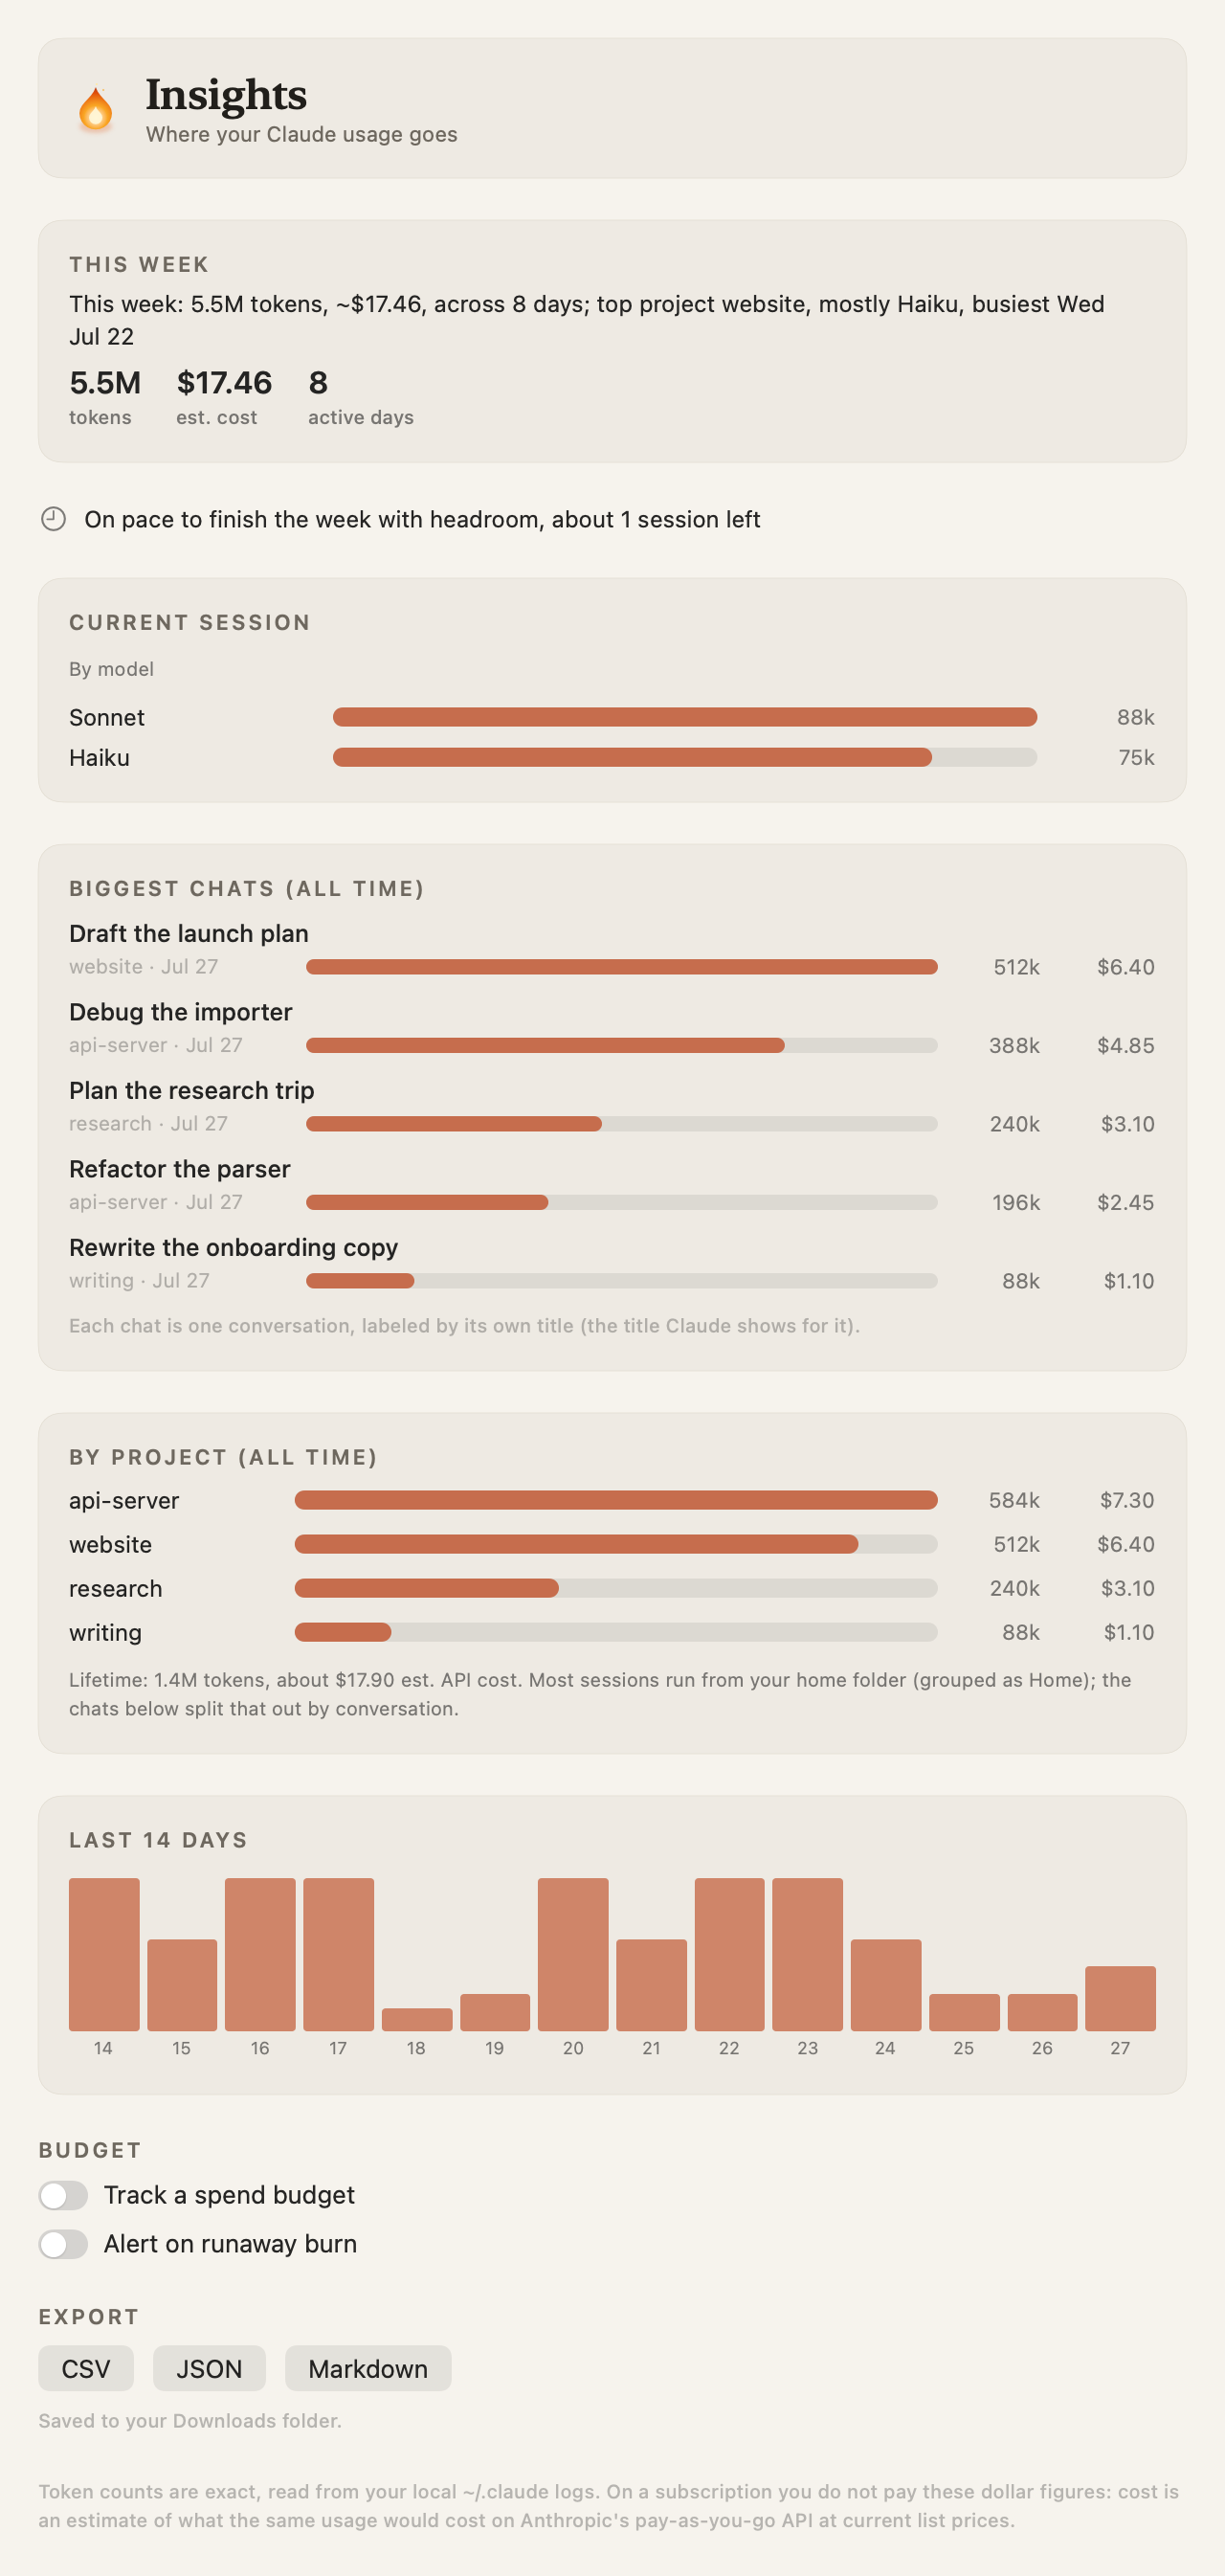
The Insights window listing the biggest chats all time, each with its tokens and estimated cost

Which chat spent it

Per-conversation and per-project attribution. The chat that quietly ate your week has a name, a token count, and an estimated cost.

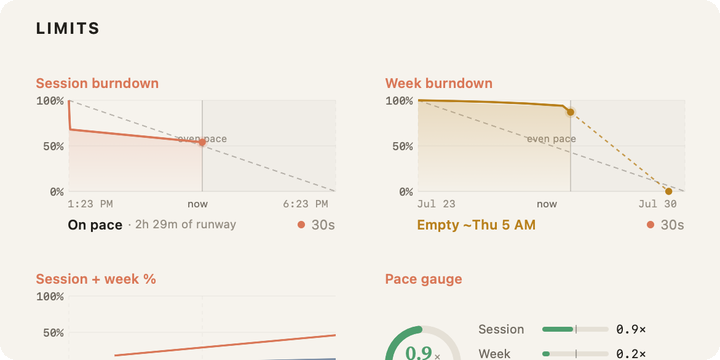
Session and week burndown charts projecting when the current pace reaches each limit

Time to limit

A forecast from your recent pace, weekly pacing in plain language, model-mix advice, and a pace gauge against the rate that lasts exactly to the reset.

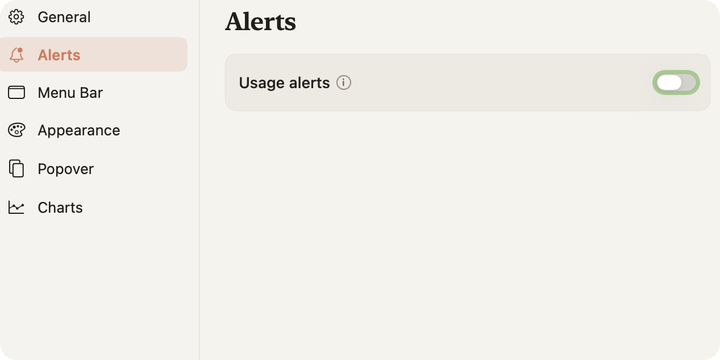
The Alerts pane in Settings, with per-threshold switches for session, weekly, Opus and Sonnet

Alerts, if you want them

Off by default. Thresholds, burn spikes, forecast warnings, spend budgets, quiet hours, and runaway detection for the agent still spending while you are at lunch.

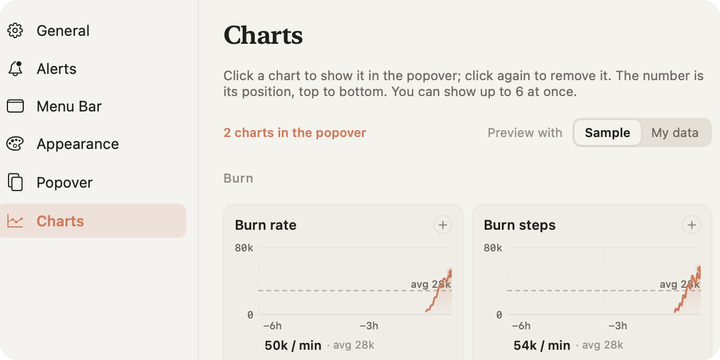
The chart gallery in Settings, every chart drawn with sample data before you pick it

Charts, two dozen of them

Burn rate, runway to the reset, hour-of-day rhythm, model and project splits, cache efficiency, spend. Each one drawn with real data before you choose it.

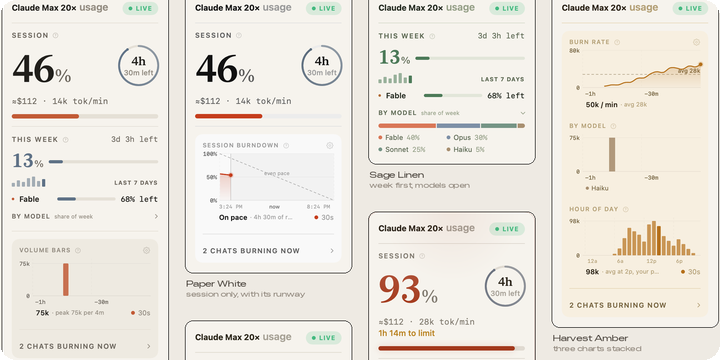
Several colour themes of the card shown side by side

Yours to shape

Twenty-plus themes, real Liquid Glass, a couple dozen menu bar glyphs, and a card you can rebuild element by element.

Attribution

Find out where the tokens actually went

Most monitors tell you that you are at 80 percent. The more useful question is what got you there. The Insights window keeps a running answer: your biggest conversations of all time by name, every project ranked, a weekly recap in words, a 14-day history, and one click to export the lot as CSV, JSON, or Markdown.

The Burndown Insights window showing a weekly recap, the current session by model, the biggest chats all time with tokens and cost, projects ranked, and a 14-day history
Insights: the weekly recap, current session by model, biggest chats, and projects.

Charts

Two dozen charts, and you see them before you pick

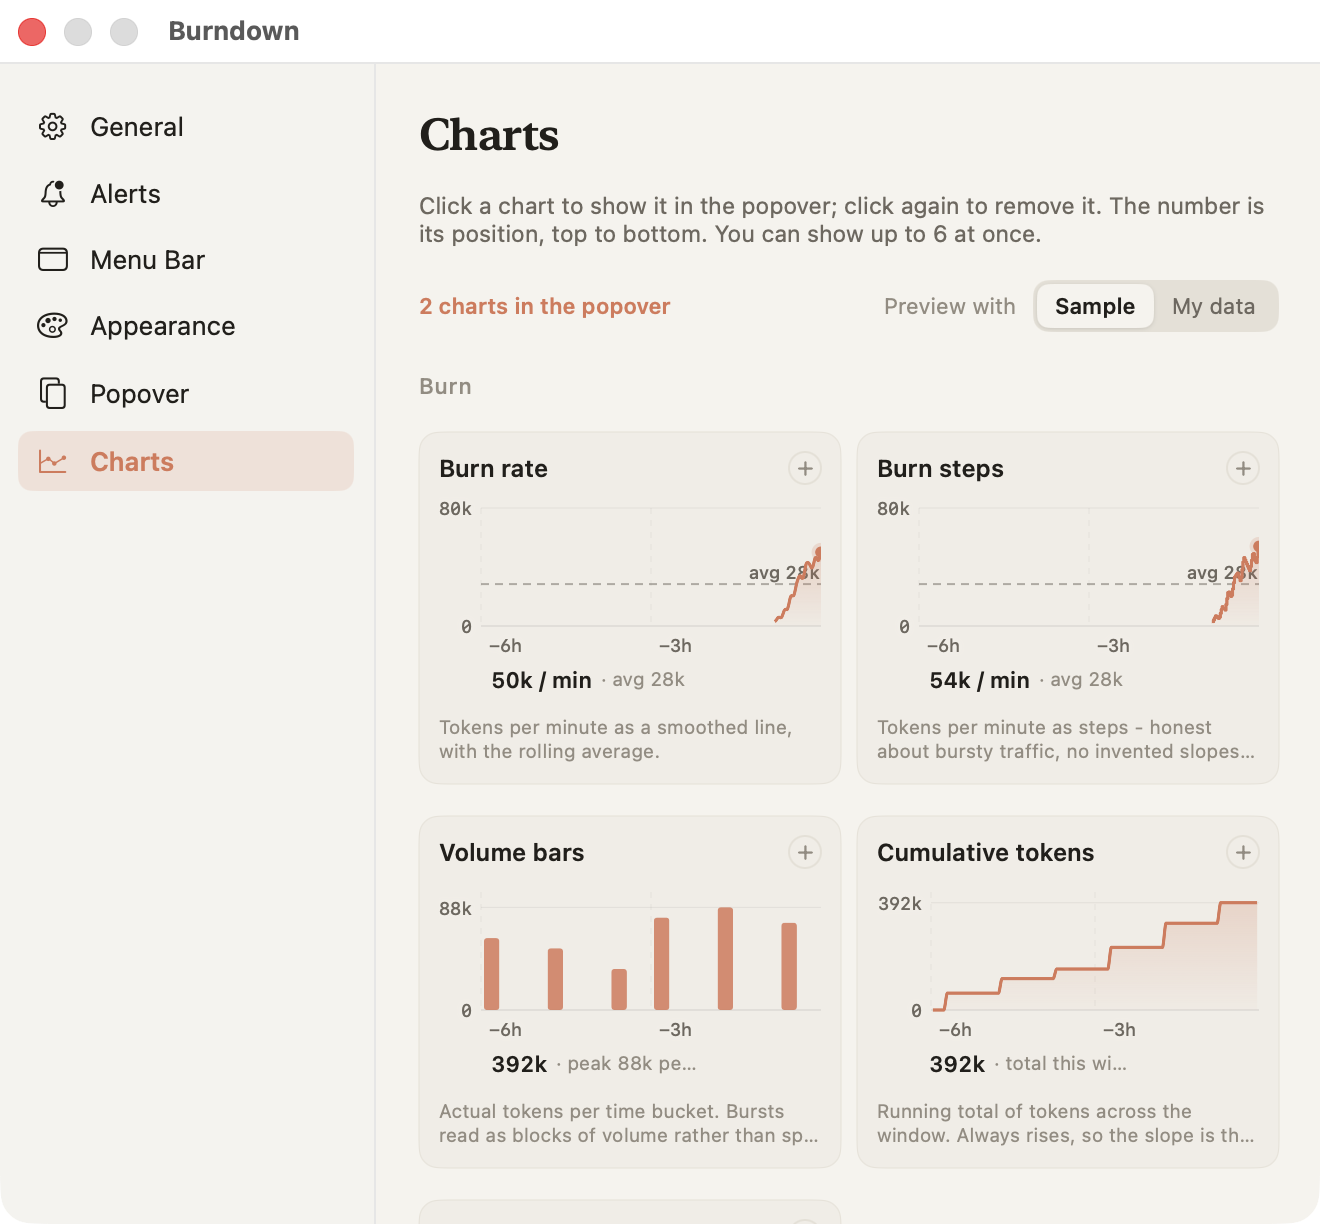
Burn data is spiky, so no single chart answers every question. Burndown ships 24, grouped by what they tell you: Burn, Limits, Breakdown, Rhythm, and Detail. The card stacks up to six of them, and the Settings gallery draws every chart with sample or live data first, so you never pick blind.

The chart gallery in Burndown Settings, where every chart is drawn with sample data so you can choose which appear on the card
The gallery. Click a chart to put it on the card; the number is its position.
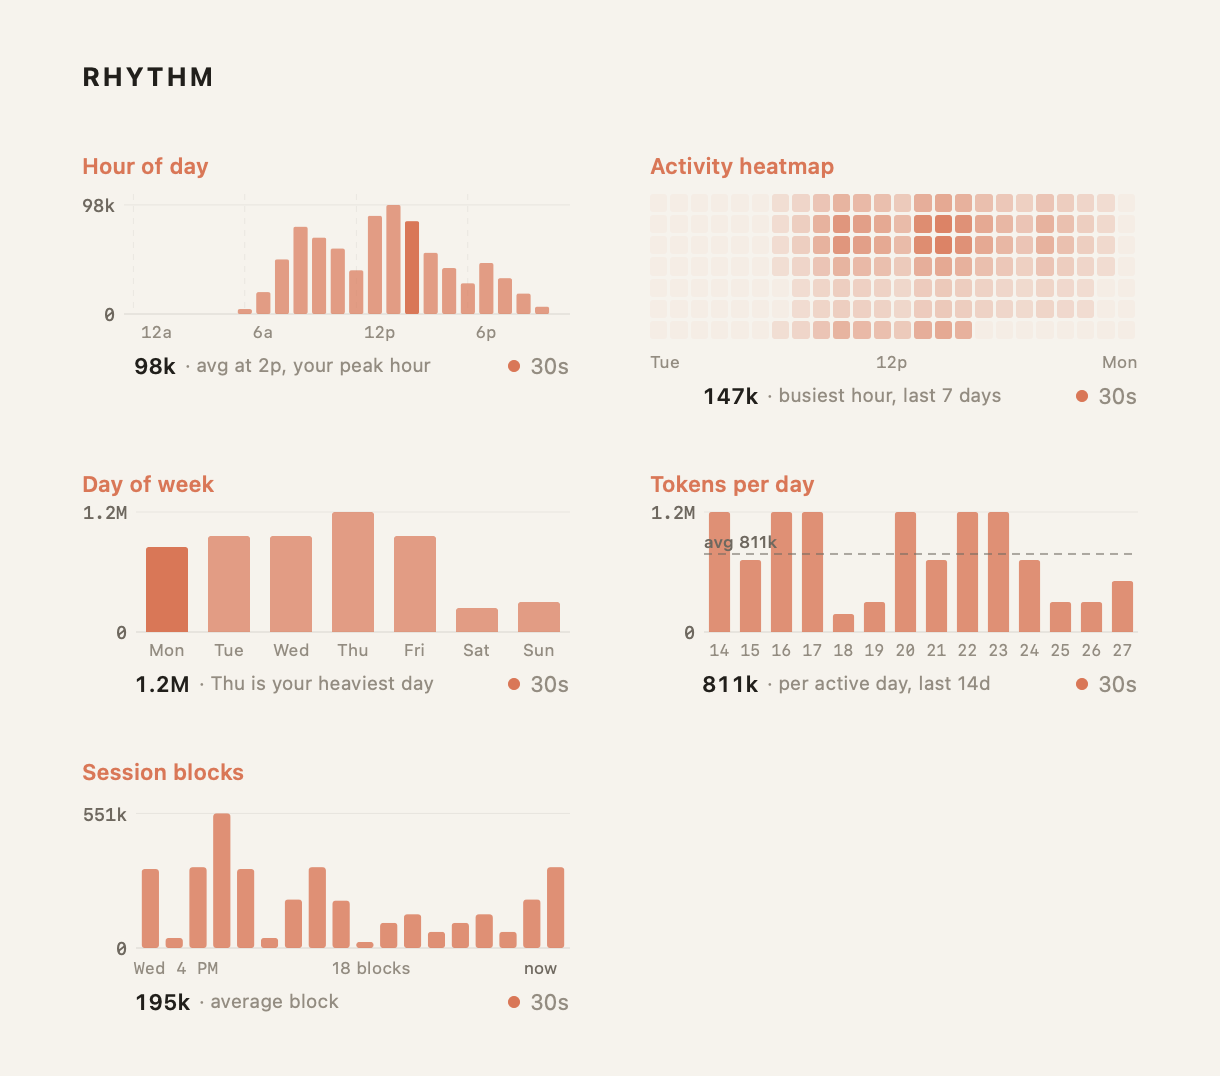
The Rhythm charts: hour of day profile, activity heatmap, day of week, tokens per day, and 5-hour session blocks
One group of five: when you actually work.

Make it yours

More themes than you will get through, and a card you can rebuild

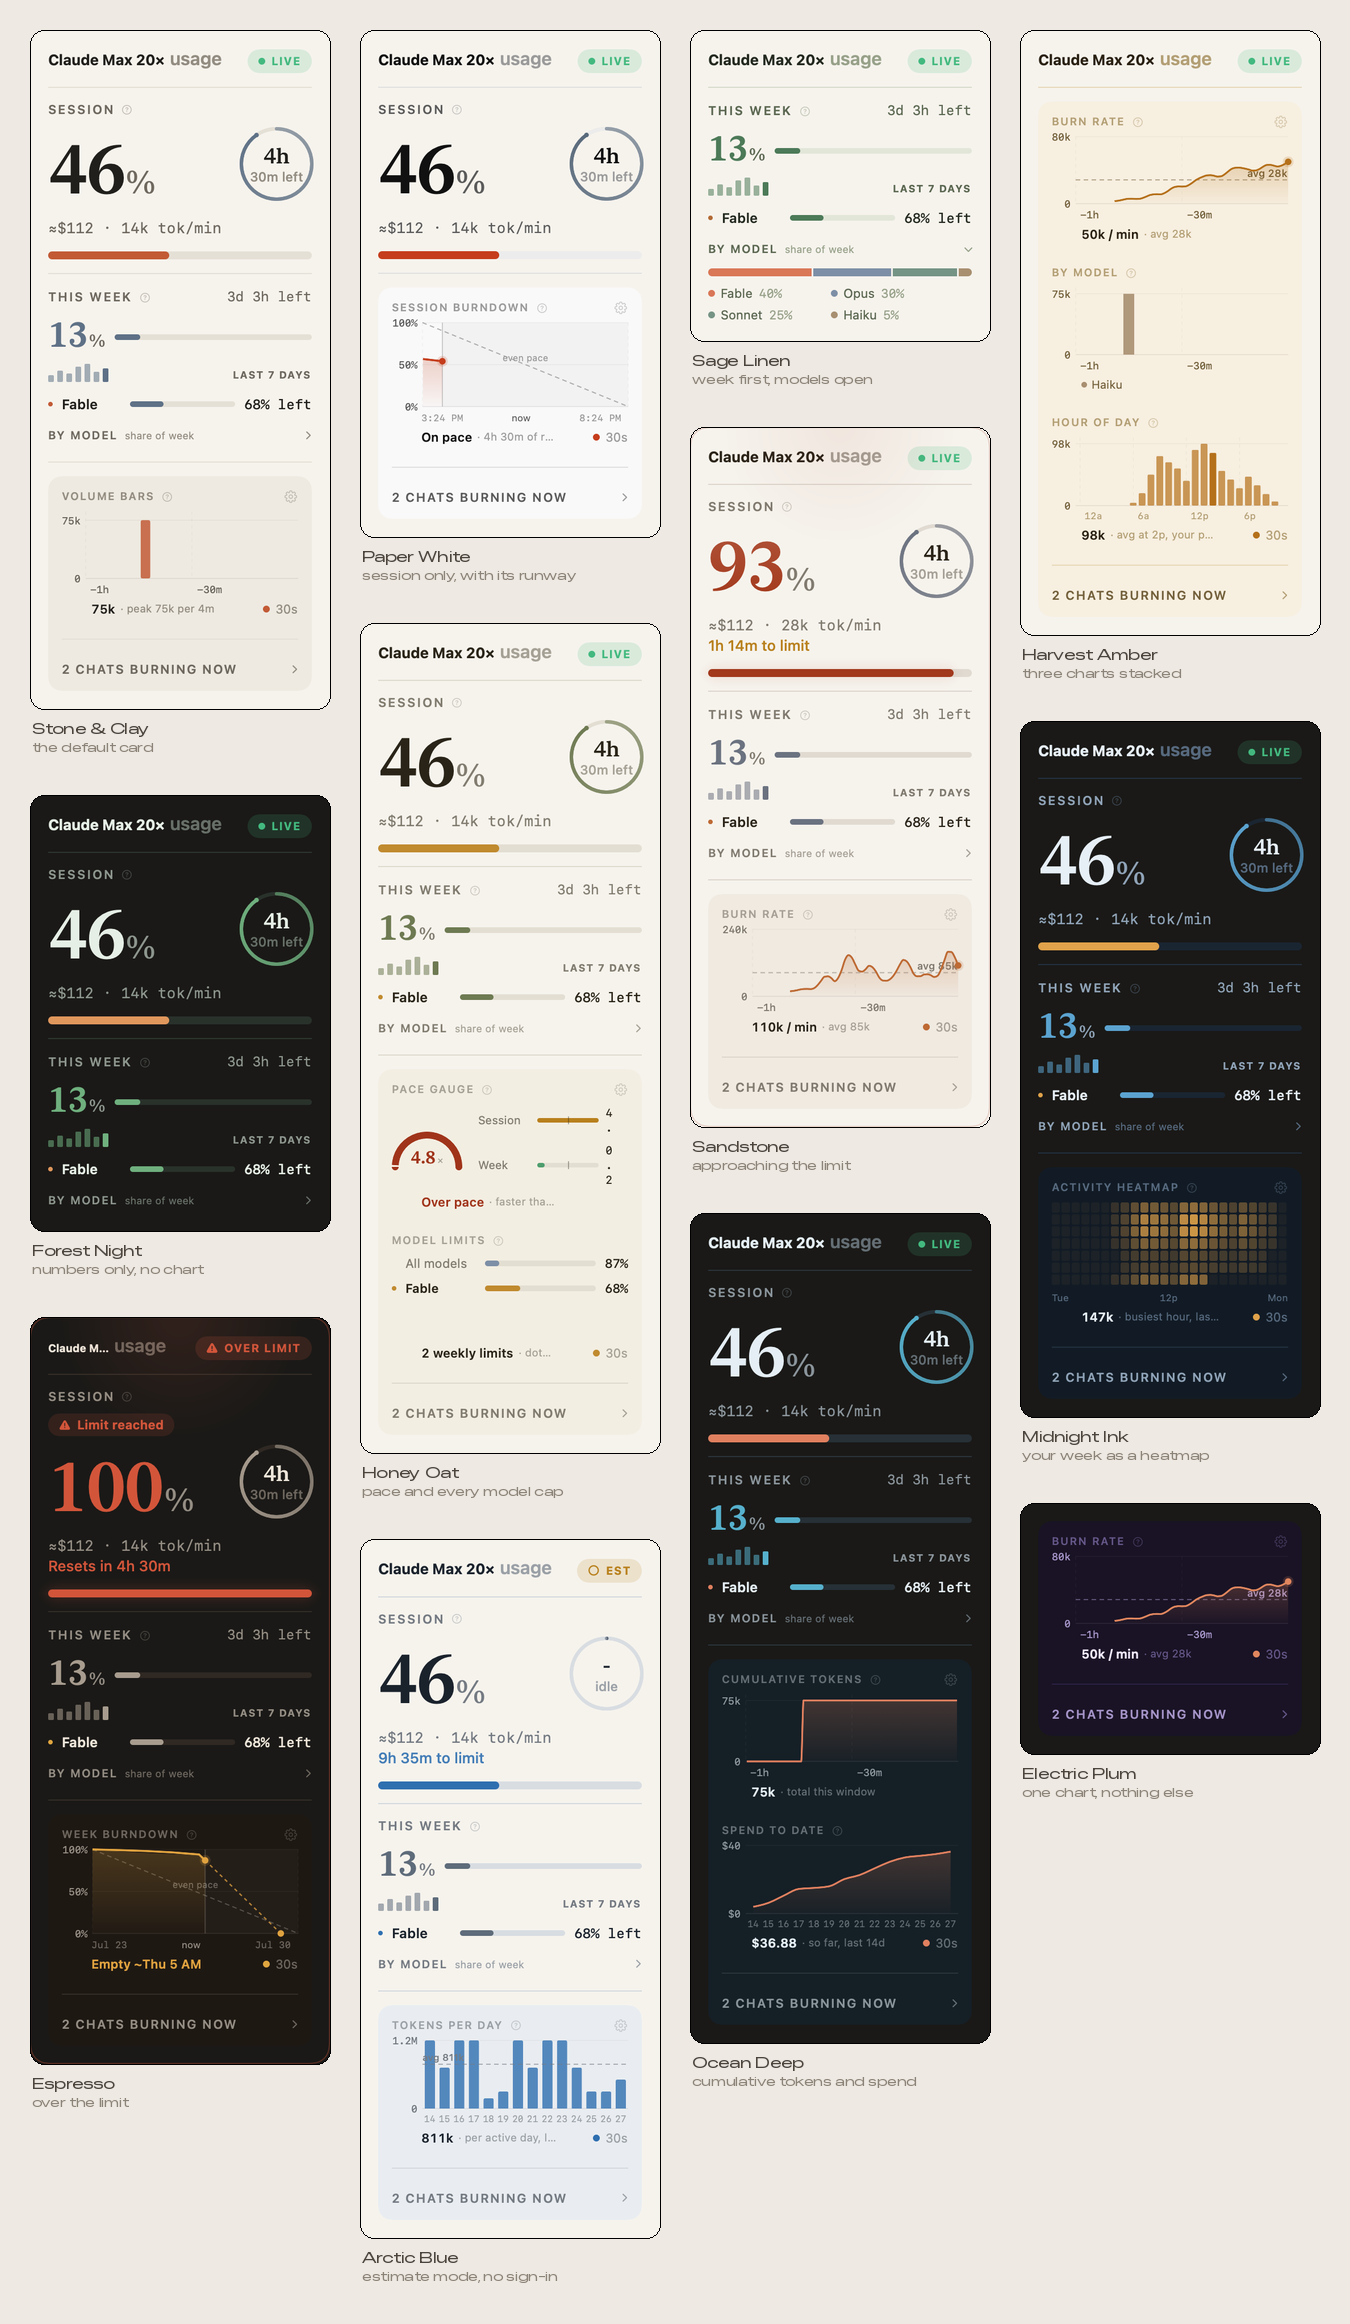
A thing you look at all day should look the way you want. Every color flows from the active palette, so one choice recolors the card, the charts, the widget, and Settings together. Here are twelve themes, each showing a different card: sections kept or dropped, one chart or three, calm or at the limit.

Twelve Burndown themes, each with a different card layout: Stone and Clay, Paper White, Sage Linen, Harvest Amber, Sandstone, Honey Oat, Midnight Ink, Forest Night, Ocean Deep, Espresso, Electric Plum and Arctic Blue
One app, twelve themes, twelve different cards.

Real glass, with the numbers to back it

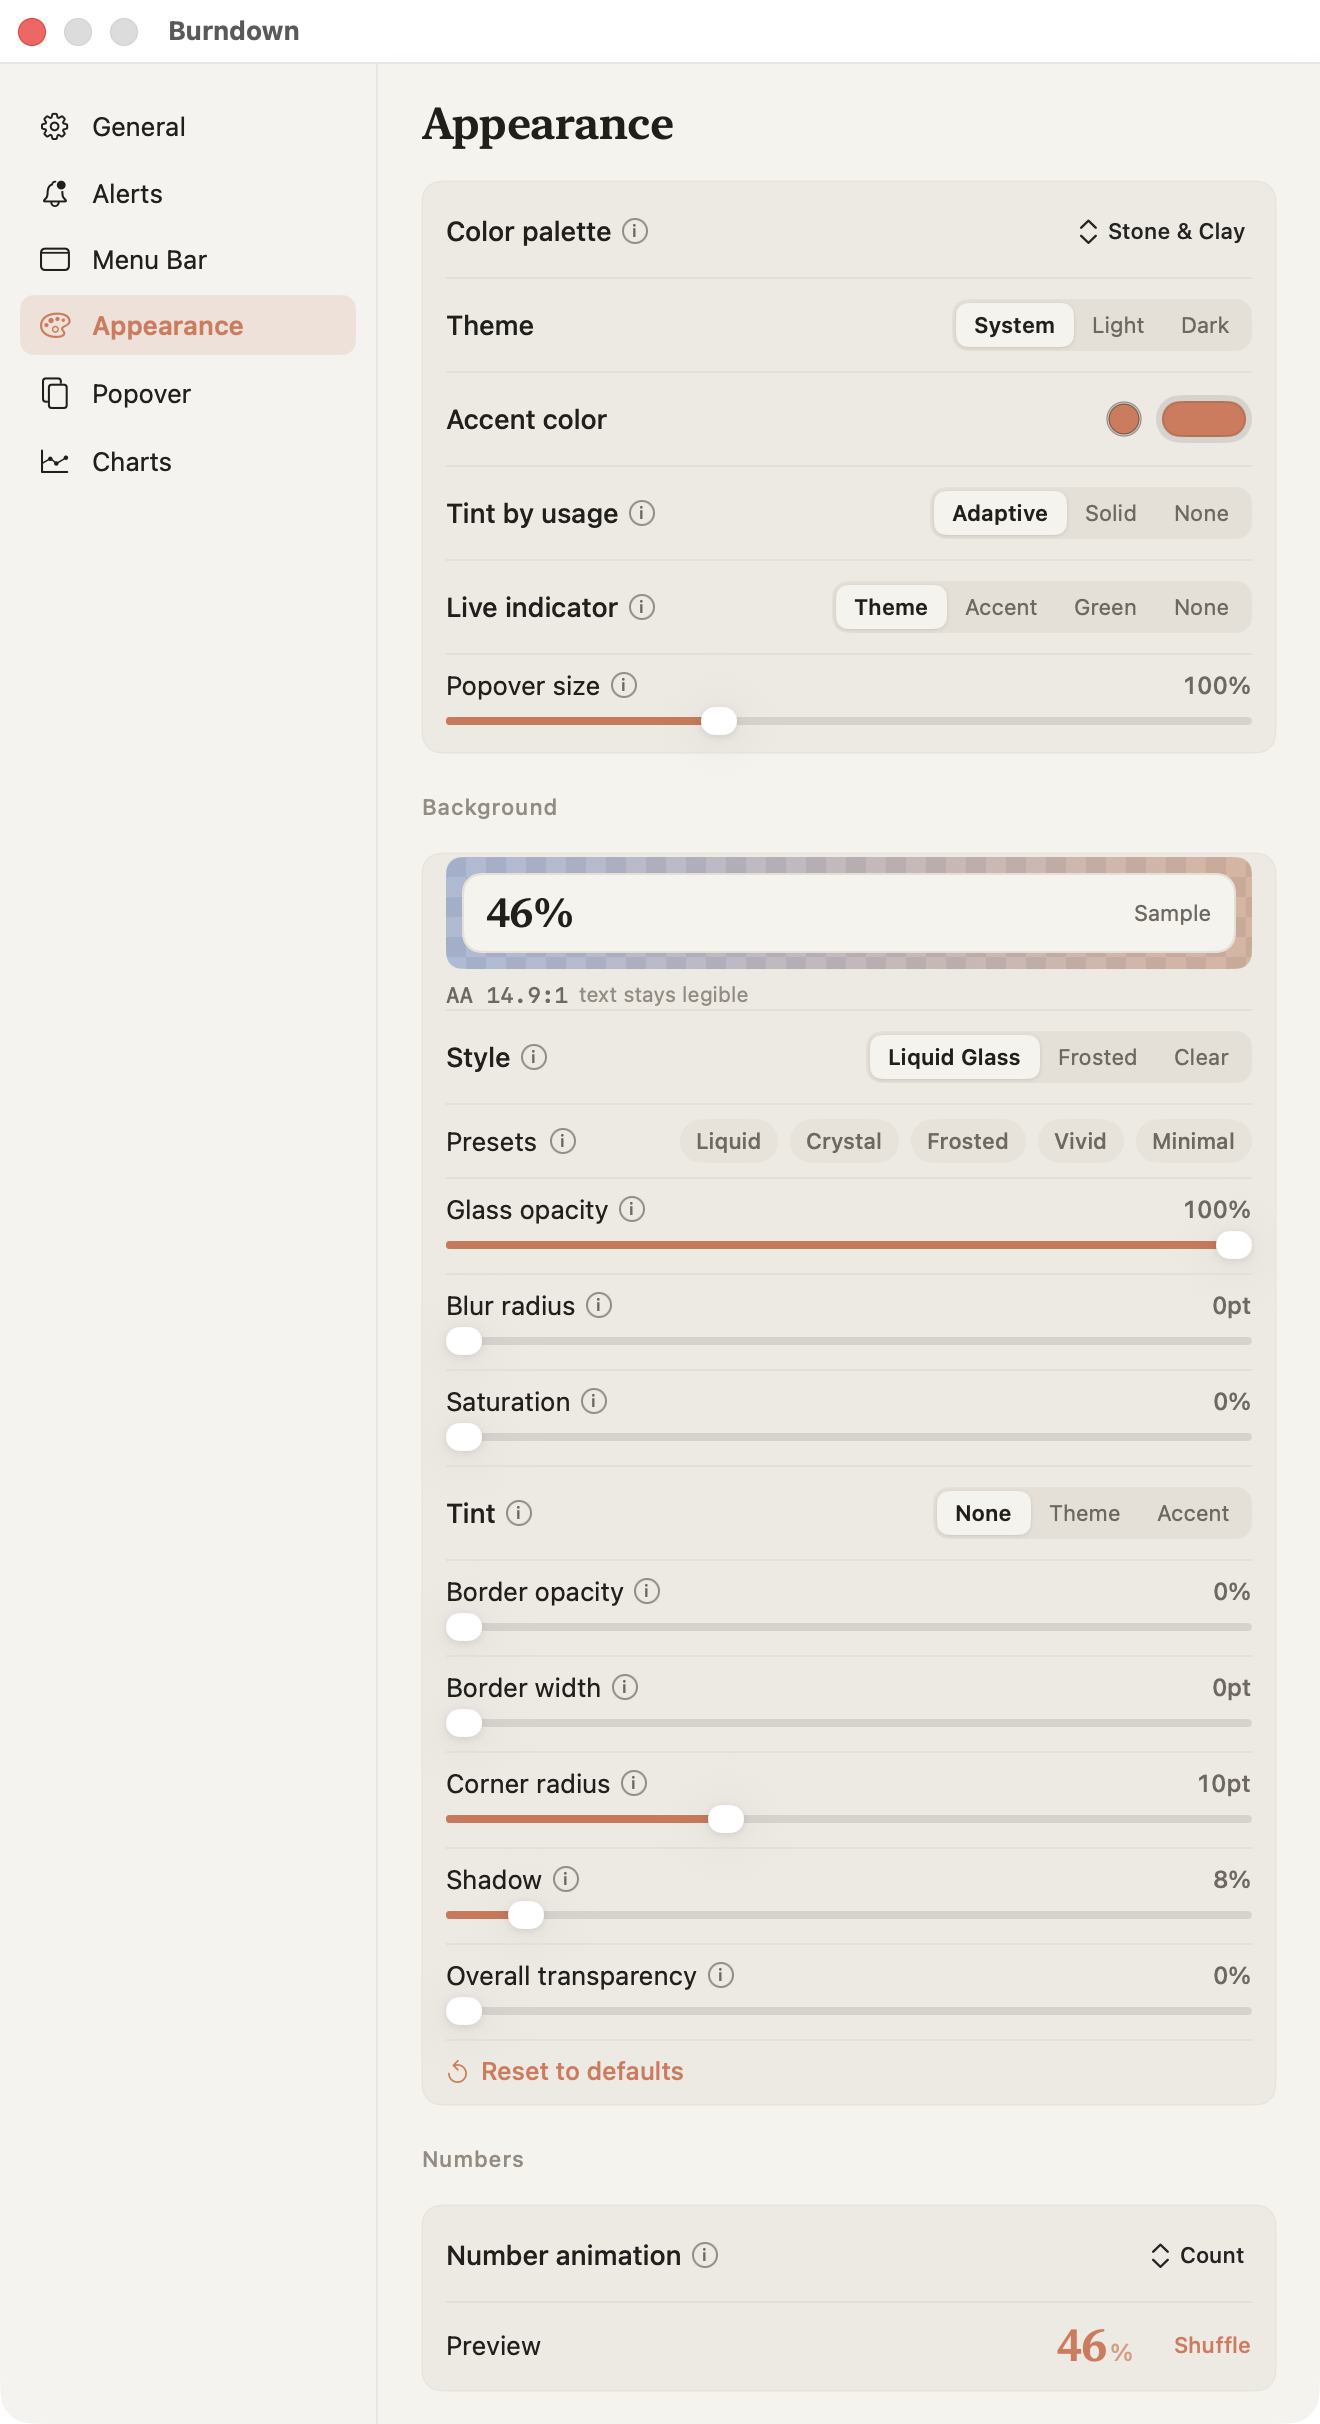
Liquid Glass on macOS 26, classic frosted blur, or fully clear, with sliders for opacity, blur, saturation, tint, borders, corner radius, shadow, and window transparency. You tune it against a live preview that shows the actual text contrast ratio, so you can push the transparency and still know the card stays readable.

The Burndown Appearance settings: theme picker, accent color, popover size, a live glass preview with a contrast readout, glass style and presets, and nine adjustment sliders
The Appearance pane, top to bottom.

Or change the menu bar entirely

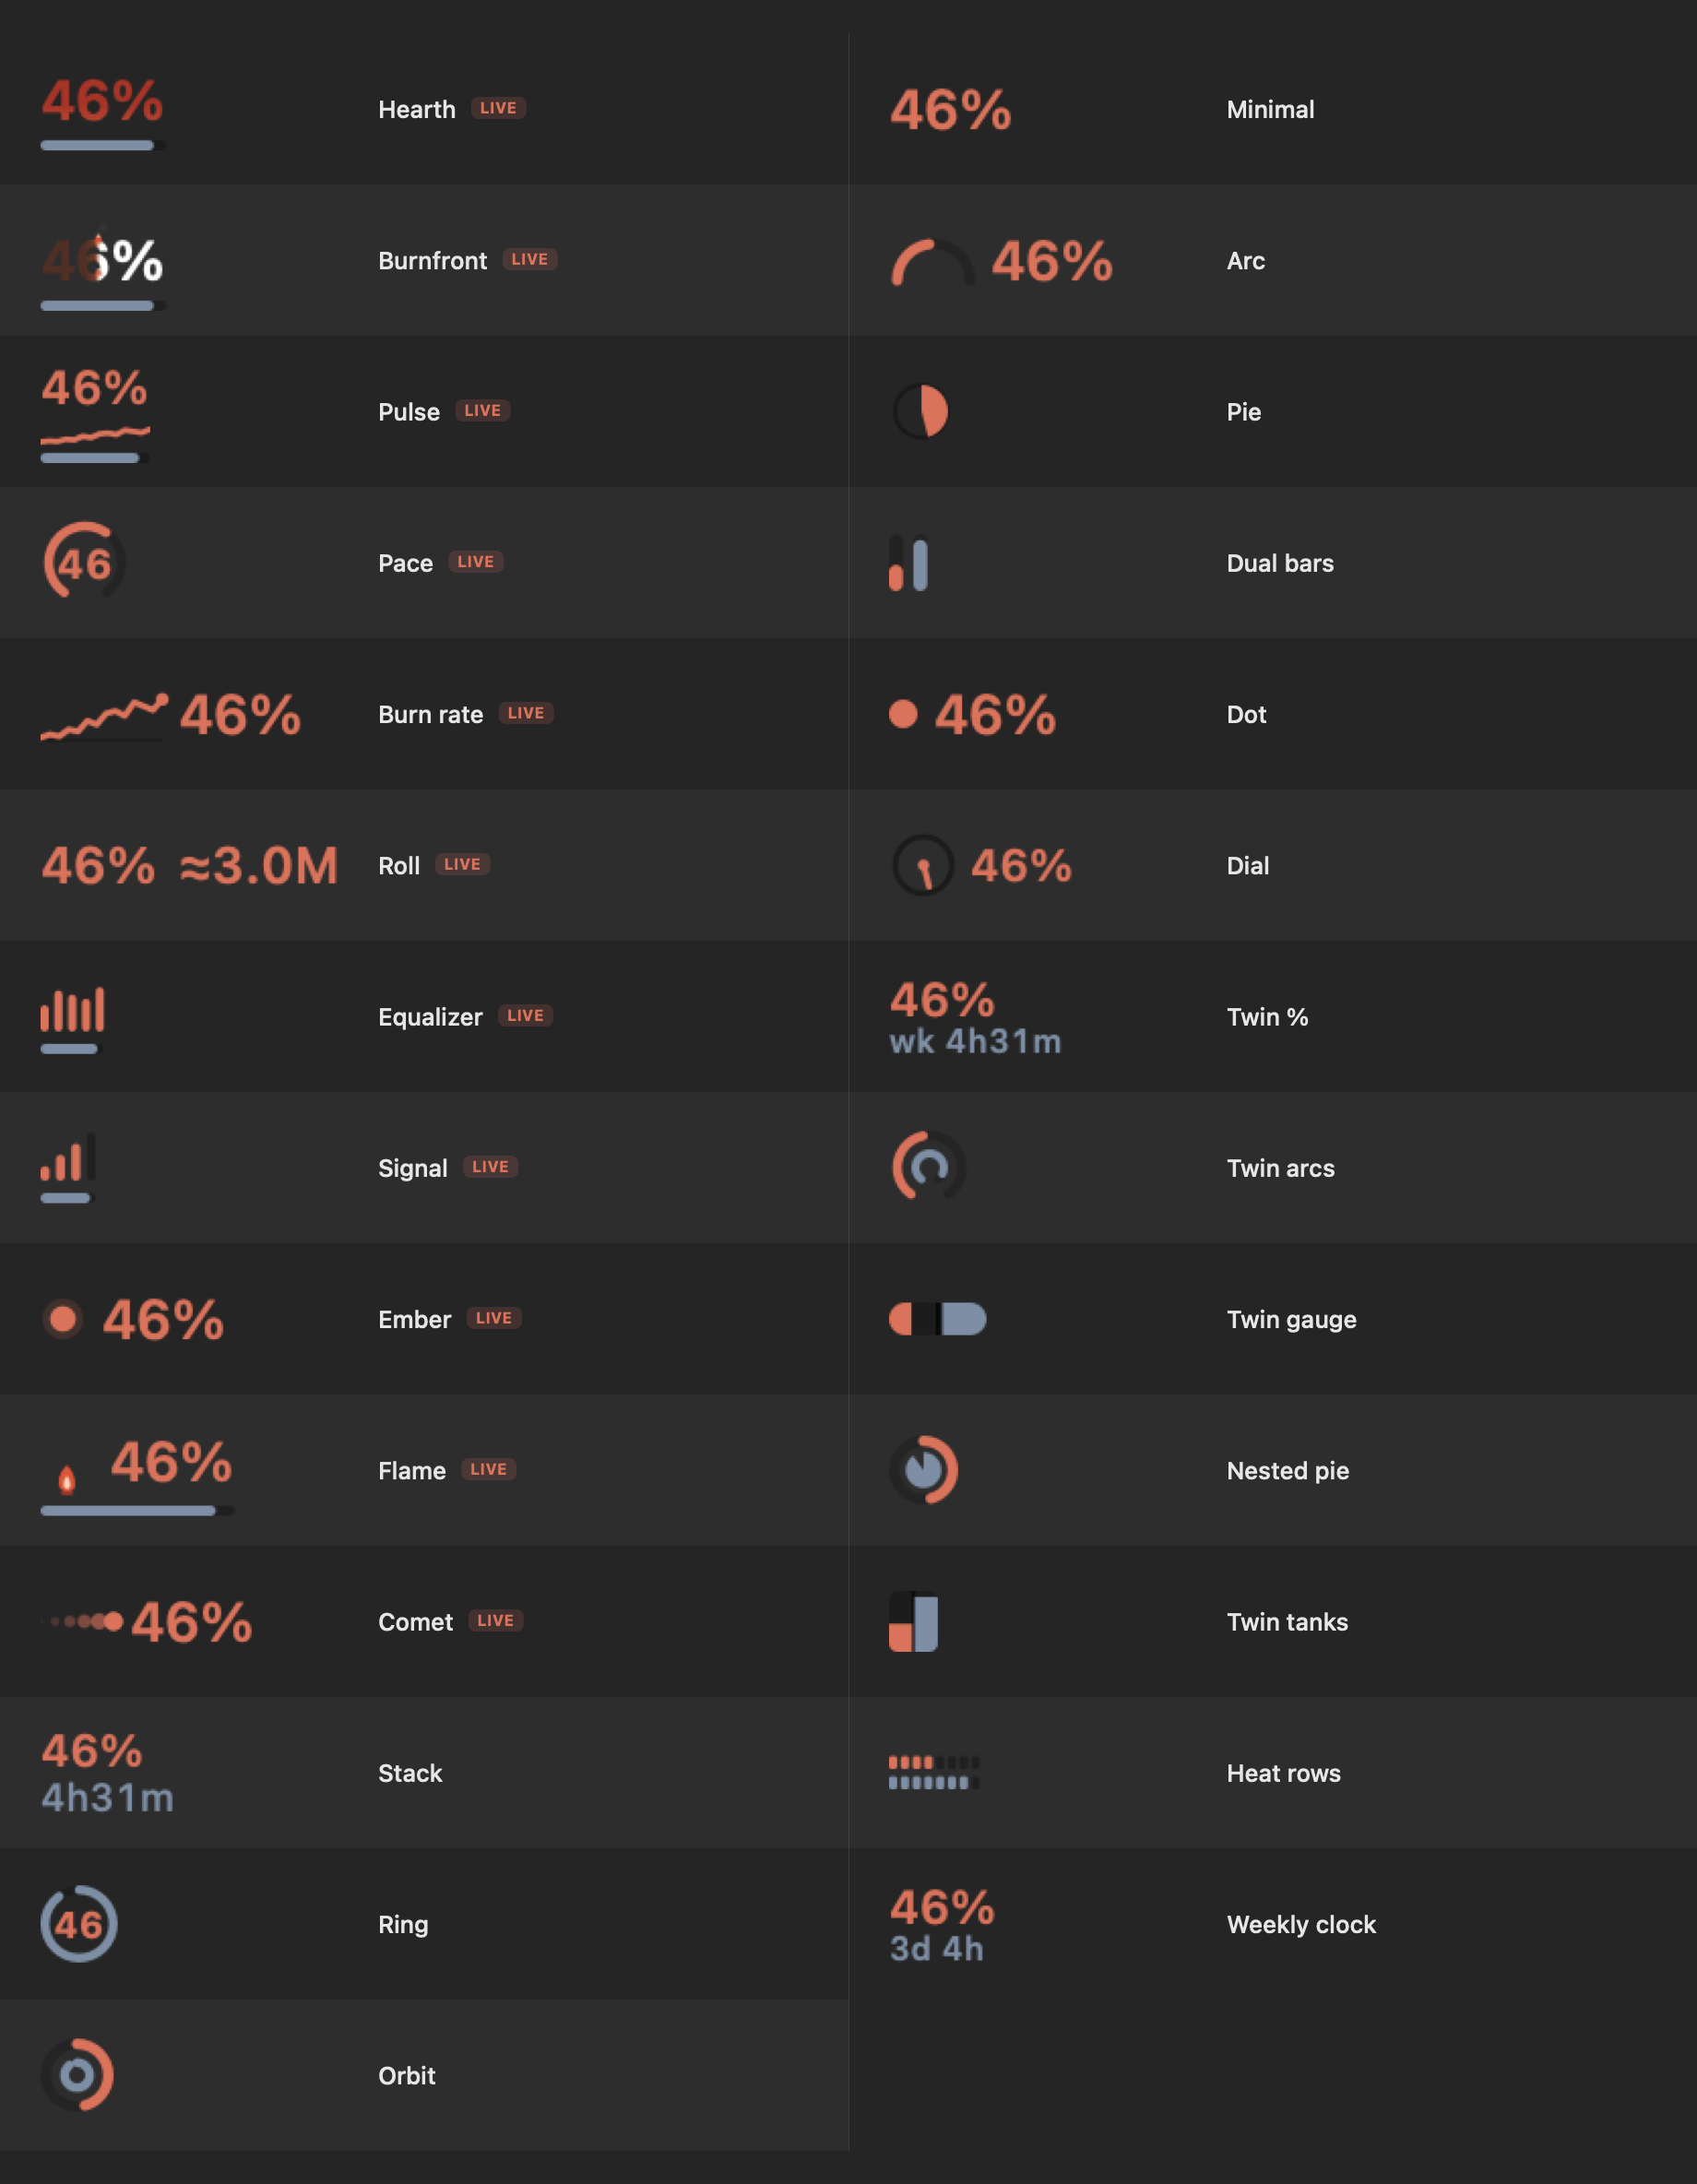
A couple dozen glyph styles: live ones that react to the token stream, static gauges, plain text down to a bare percentage, and twin styles showing session and week at once. Including, yes, a flame that burns hotter as you spend. It is a nice touch, not the point.

A contact sheet of Burndown menu bar glyph styles, including live styles, rings, arcs, pies, sparklines, and burning numerals

Beyond the menu bar

It meets you where you work

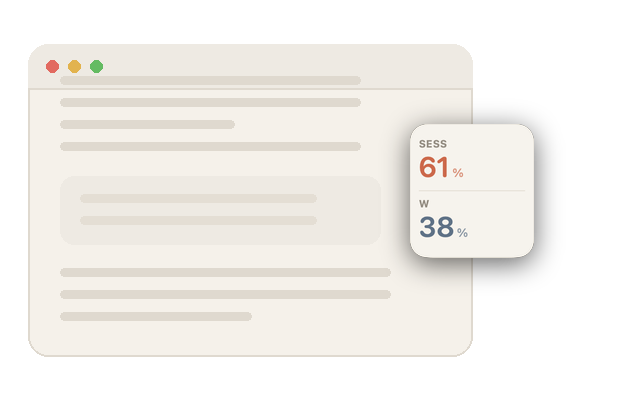
A stylised app window with the Burndown widget docked to its right edge, showing 61 percent of the session and 38 percent of the week

A widget on the Claude window

Docks to an edge of the Claude Desktop window and follows it as you move and resize, appearing only while Claude is frontmost. Six looks, draggable and lockable.

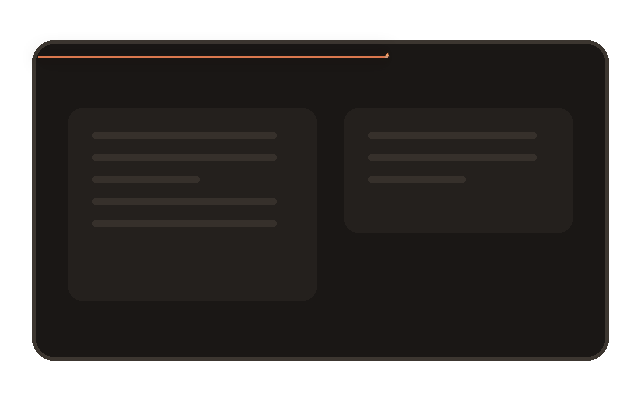
A stylised display with the Ember Line running along its top edge, the lit span showing how much of the session is left

An edge meter

The Ember Line is a quiet filament along a screen edge, on every display if you want. The bright span is what is left of your session. Eight styles.

The Burndown card floating above other windows on a dark desktop, showing session and weekly usage

A floating card

The same card, pinned anywhere on your desktop, optionally always on top and optionally without a title bar.

And in your terminal

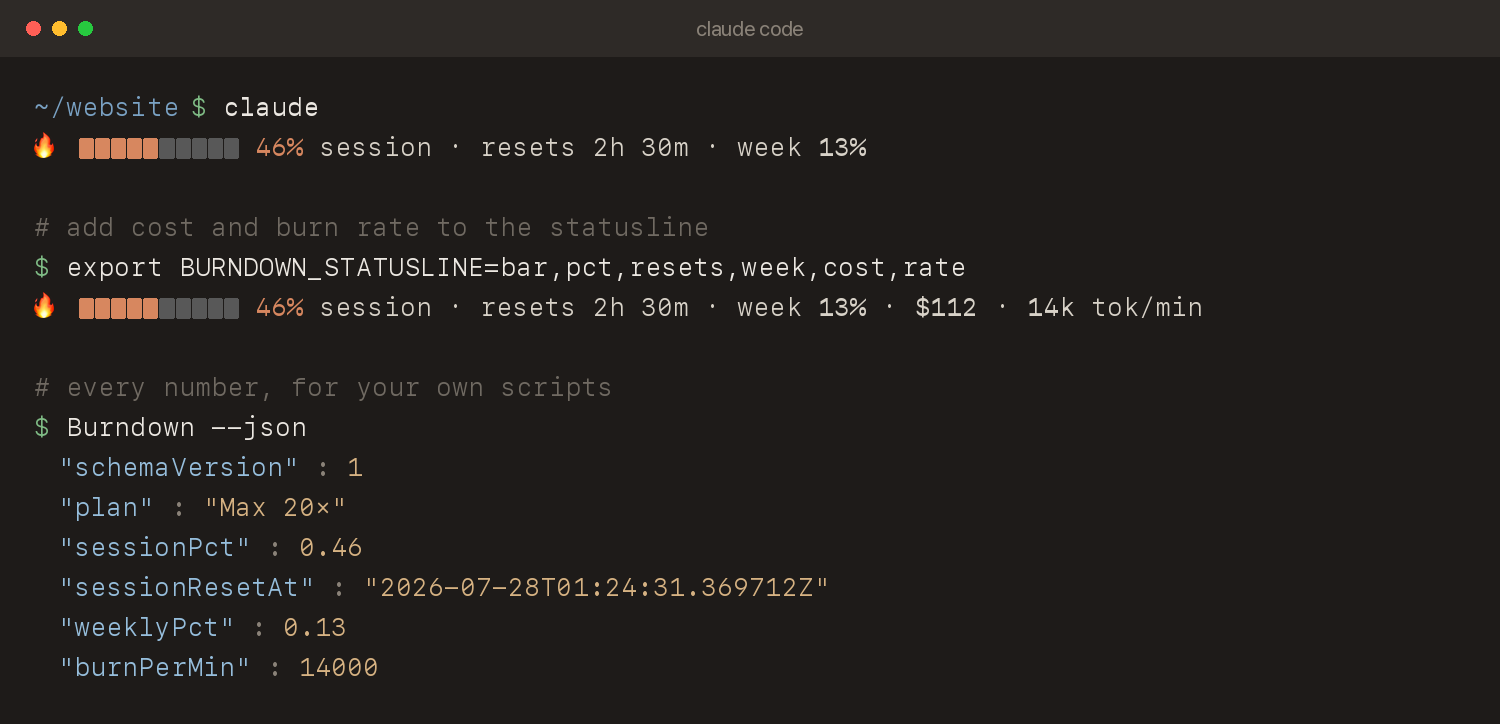
One click installs a live gauge into the Claude Code statusline, composable from six segments. Every number is also available to your own scripts through a documented, versioned JSON contract, so Raycast scripts, Stream Deck buttons, and custom statuslines can read it without scraping anything.

A terminal running Claude Code with the Burndown statusline gauge showing 46 percent session used, the same line reconfigured to add cost and burn rate, and the output of Burndown --json

Honest comparison

How it compares

There are good tools in this space and Burndown does not replace all of them. Here is a fair map, so you can pick the right one rather than the loudest one.

If you wantReach for
Reports in a terminal, across many coding agents ccusage is excellent and covers far more than Claude. Claude-Code-Usage-Monitor adds machine-learning limit prediction.
A simple always-visible percentage, signed and localized Several native menu bar apps do this well, including Claude Usage Tracker and ClaudeUsageBar. If a plain meter is all you need, they are a fine choice.
Other providers too: OpenAI, Gemini, xAI and friends Burndown goes deepest on Claude today, and support for other providers is actively in development. If you need several providers in one pane this week, a multi-tool tracker covers the gap; if you can wait, this is where Burndown is heading.
Depth: where the tokens went, what happens next, and a UI you can shape Burndown. Per-chat attribution by conversation name, two dozen charts with a preview gallery, forecasting and pacing, adaptive runaway detection, budgets, exports, a JSON contract, twenty-plus themes and real glass. Free, open source, entirely local.

Where this is going. Burndown is early and moving quickly. Coverage for other providers, including OpenAI, Gemini and xAI, is in active development, along with a steady run of new features. Watch the releases or say what you need in Discussions: it is a young project, so the odds of your request landing are unusually good.

One thing to know before you download: Burndown is not yet Developer ID signed, so macOS asks once on first open. Some alternatives are signed. That is a real difference and it is on the roadmap rather than hidden here.

Getting started

Running in about a minute

  1. Install it

    Use Homebrew, or download the release and drag Burndown to Applications. Because the build is ad-hoc signed, macOS blocks the first open of a downloaded copy: run xattr -d com.apple.quarantine /Applications/Burndown.app, or click Open Anyway in System Settings, Privacy & Security. All four routes are in the guide.

  2. Say hello

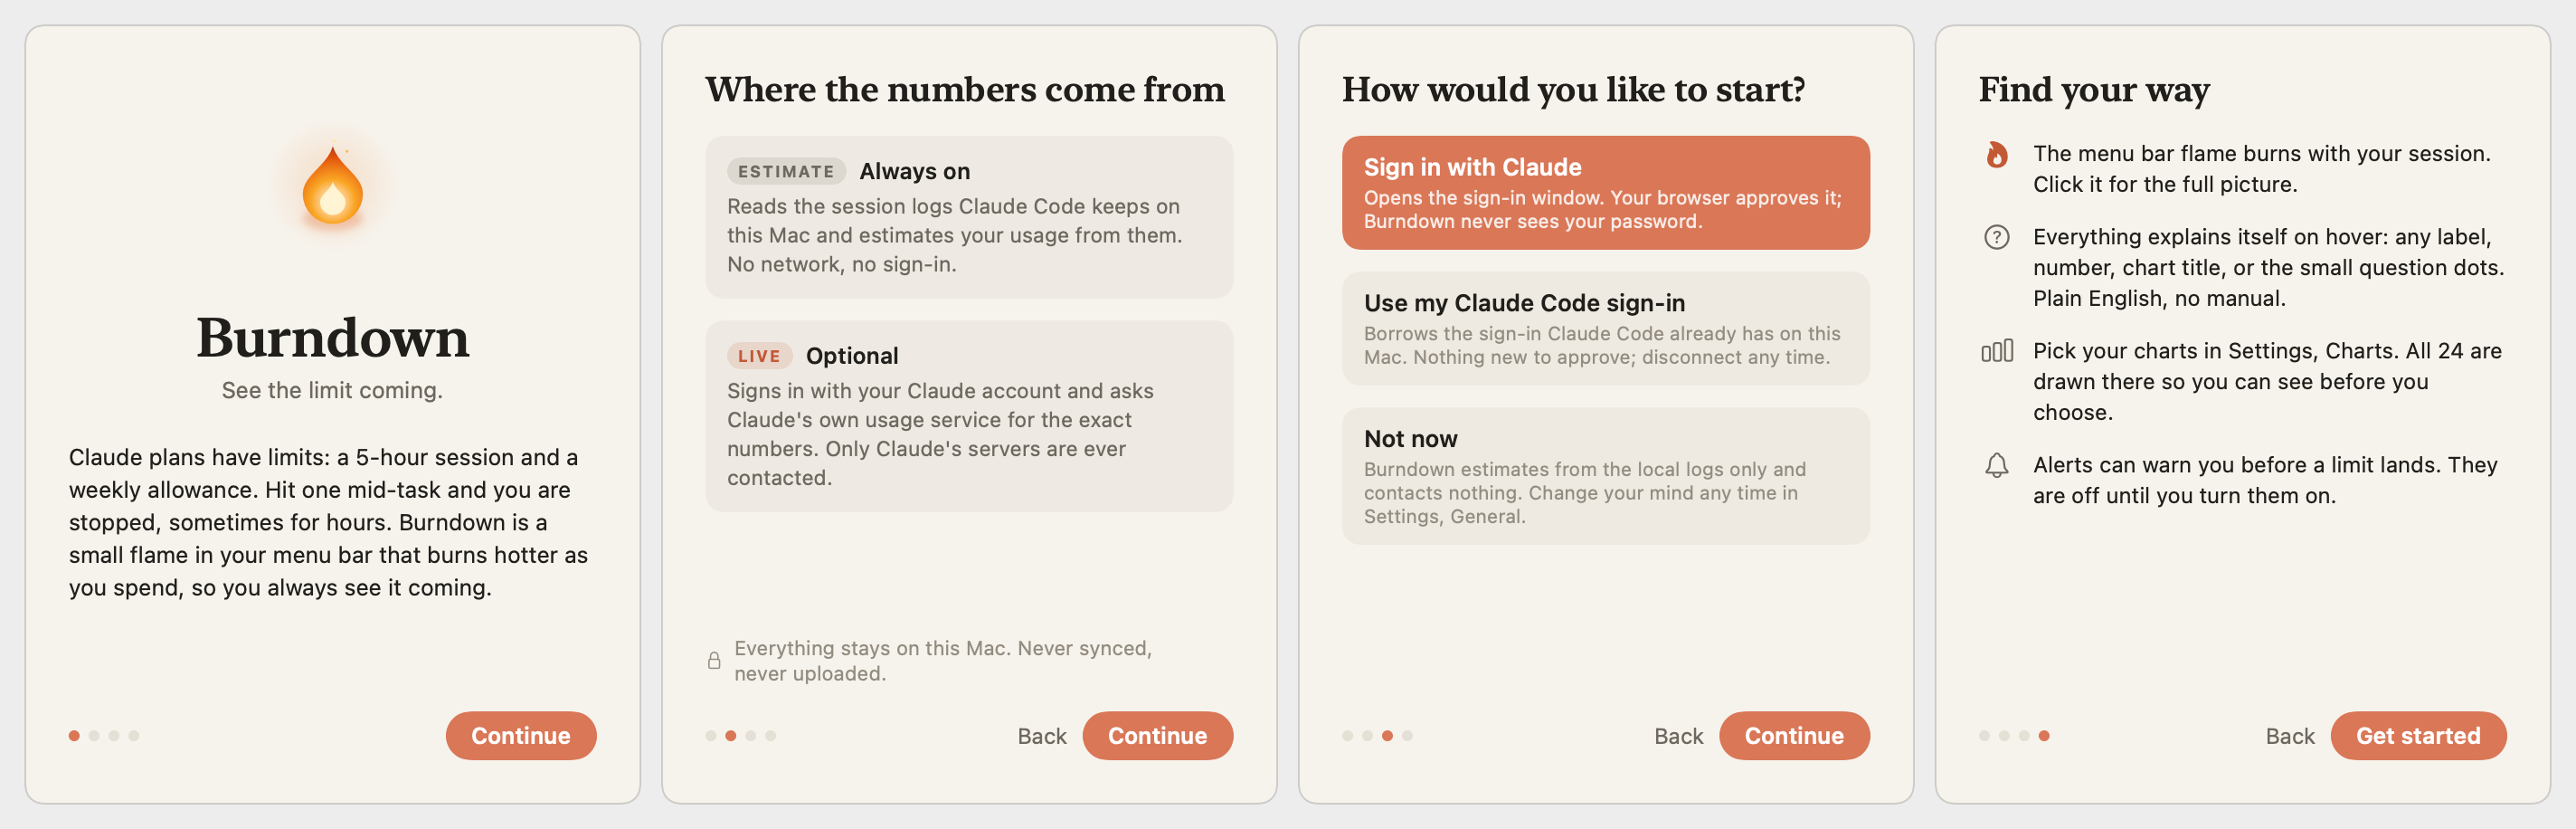
    A short welcome tour explains the two data sources and offers to connect. You can skip it: with no sign-in at all, Burndown estimates from the Claude Code logs already on your Mac and contacts nothing.

  3. Turn on live numbers, or do not

    Signing in switches to the exact server-side figures behind Claude's own usage page. If Claude Code is already signed in on this Mac, one button borrows that instead. Both are reversible any time.

  4. Pick your charts and your look

    Settings, Charts shows all 24 drawn with real data. Click up to six. Then Appearance for the theme, the glass, and the menu bar style.

  5. Optional: let it warn you

    Settings, Alerts. Everything is off until you turn it on. Most people want a session threshold and the forecast warning.

The four pages of the Burndown welcome tour: what it is, where the numbers come from, how to connect, and how to find your way around

The full guide covers every feature, the JSON contract, and troubleshooting.

Privacy

It all stays on your Mac

Nothing is sent anywhere

No analytics, no crash reporting, no servers operated by this project. Nothing about you or your usage is collected anywhere.

Estimate mode is offline

The default on a fresh install reads local Claude Code logs and makes no network requests at all.

Live mode talks only to Claude

Opt-in, using your own sign-in through your browser. The app never sees your password, and the only hosts contacted are Anthropic's.

Sign out means sign out

It deletes the stored token, revokes permission to borrow the Claude Code sign-in, and clears the diagnostic log. Local files are owner-only.

Full detail in the privacy policy, and the mechanism live mode uses, along with its risks, is documented in TOS_NOTES. Nothing is hidden: the endpoint is undocumented and could change, and if it does the app falls back to estimates and keeps working.

Questions

Frequently asked

Is Burndown really free?

Yes. Free, open source, and Apache 2.0 licensed. There is no paid tier, no premium build, no subscription, no account to create, and no telemetry. Every feature on this page is in the free download.

Do I have to sign in to use it?

No. A fresh install runs in estimate mode, which reads the session logs Claude Code already keeps on your Mac and makes no network requests at all. Signing in is a separate, explicit opt-in that switches on live mode, where the numbers come from Claude's own usage service.

Is my data safe?

Everything stays on your Mac. There is no telemetry and no server operated by the project. In live mode the only hosts contacted are Anthropic's own. The updater contacts GitHub for a version number and, if you choose to install, the release file. Local state lives in ~/.config/burndown with owner-only permissions, and signing out deletes the stored token and clears the diagnostic log.

Will it slow my Mac down?

No. The card tears its whole view tree down when you close it, so it costs almost nothing while hidden, and the app idles at a couple of percent of one core with an animated menu bar style. Choose a static style and even that goes away.

Why does macOS warn me the first time I open it?

Releases are ad-hoc signed because the project does not yet have a paid Apple Developer ID certificate, so macOS quarantines a downloaded copy and Gatekeeper blocks the first open. Four ways past it, in order of least friction:

  • Install with Homebrew, prefixing the command with HOMEBREW_CASK_OPTS="--no-quarantine". That tells Homebrew not to attach the quarantine flag. Homebrew's own docs call it a Gatekeeper bypass that reduces system security, so it is your call to make.
  • After a manual download, run xattr -d com.apple.quarantine /Applications/Burndown.app.
  • Without the Terminal: let the launch get blocked, then open System Settings, Privacy & Security, scroll down to Security, and click Open Anyway, entering your login password. That button only shows up for about an hour after a blocked launch, so try opening the app again if you do not see it.
  • Build from source with ./build.sh. An app you compiled locally is never quarantined, so Gatekeeper never appears at all.

macOS 15 removed the old right-click, Open shortcut, and Homebrew removed the --no-quarantine command-line flag, so any guide still recommending those is out of date.

Could using Burndown get my Claude account banned?

Burndown is a read-only monitor. It never runs inference with your token and never spends your subscription; it only asks how much you have used. Anthropic's February 2026 enforcement targeted a different class of tool, third-party coding clients that spend subscriptions through OAuth. Read-only monitors continue to operate publicly without known enforcement. The call remains Anthropic's, which is exactly why live mode is opt-in and the mechanism is documented in plain English.

Does it work on Claude Pro, or only Max?

Both. Burndown does not hardcode plan shapes. It shows whatever limits your account reports, including any per-model caps, and the Account window can re-read your plan on the spot after an upgrade.

I only use Claude in the browser or the desktop app. Does it still work?

Live mode, yes. Your limits are account-wide server-side numbers, so percentages, resets, forecasts and alerts all work no matter where you use Claude. Estimate mode and the attribution features are built from the logs Claude Code writes, so those cover Claude Code sessions.

Does it run on Intel Macs?

Yes. Releases are universal binaries covering Apple Silicon and Intel, and macOS 13 or later is required.

How do updates work?

Burndown checks GitHub once a day for a newer version and tells you in the menu when one exists. One click installs it: the download is verified against its published SHA-256 checksum and its signature, the app is replaced in place, and it restarts. You can turn the daily check off.

Say hello

Get in touch

Burndown is made by one person, and feedback genuinely shapes it. If something is broken, confusing, or missing, the fastest way to change that is to say so.

Ask a question

Discussions is the friendly place for questions, setups, and half-formed ideas. No template, no pressure.

Report a problem

Bugs and feature requests. There is a short template, and screenshots help more than anything.

Read the source

Every line is public, under the Apache License 2.0. Sixteen test suites come with it, so you can verify rather than trust.

Download Burndown, free